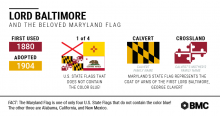
You’d be hard-pressed to go anywhere in Maryland without seeing proud residents sporting the arms of the Calvert and Crossland families, which are emblazoned on the state flag, and apparel ranging from sunglasses to socks. Maybe the flag’s popularity is because of its bright colors, busy design, or simply brilliant marketing by the state’s Tourism Board. But we’d like to think that the flag’s popularity has to do with its post-Civil War rebranding, which was intended to reconcile, quite literally, warring neighbors. Either way, its colors and patterns are rooted in the inception of Maryland’s colonial charter, which marks its 386th anniversary on Wednesday, June 20. For the occasion, we dug into our archives to present a brief history of the western world’s founding of the colony of Maryland and it’s appeal to His Royal Highness Charles I, King of England. Hint: The appeal is expansion and trade. Before European subjugation, there is evidence of inhabitants in the area dating back to the ice age. Captain John Smith - yes, the John Smith from the Disney movie - explored the upper Chesapeake in the early 1600s, and encountered many indigenous American Indians. Algonquin tribes claimed most of the land, although both Iroquois and Sioux also maintained a presence. As a result of his exploration, Smith couldn’t help but go on and on about how in awe he was over the beauty of the upper Chesapeake. We’ve hiked along the Patapsco River on a nice fall day, so we totally get the appeal, John. In fact, that’s the reason that William Claiborne, the pioneer and surveyor, first traveled to Virginia and then established a trading post on Kent Island in what’s now Queen Anne’s County. Once trade was established, the nobility and legality followed. George Calvert, the first Lord of Baltimore, explored the Potomac River and Chesapeake Bay, following stints in Newfoundland and Virginia. Calvert originally asked the king for permission to colonize the land south of Virginia, but was met with objections from its people. The king ultimately granted Calvert the land north of Virginia, but he died during the preparation of Maryland’s charter. So the land went to his heir, Cecil Calvert, the second Lord Baltimore. Once the charter’s ink was dry, King Charles I, named the new colony after his wife Queen Henrietta Marie using the name “Terra Mariae,” which means Mary Land. On November 22, 1633, Cecil Calvert set sail for this new colony in two ships - the Ark and the Dove. The ships arrived at the mouth of the Chesapeake at Old Point Comfort three months later, and sailed north to St. Clements Island before negotiating and purchasing land that they named St. Mary’s. At the end of May 1934, the Ark returned to England, leaving the Dove behind to provide transportation for goods – ranging from corn to cod - to be traded up and down the Atlantic seacoast. In August 1635, the Dove sailed back to England with furs and timber to trade, but was never seen again. The Calvert heritage can be seen on both the state seal and state flag. The Calvert colors of gold and black appear opposite the red and white colors of the Crossland family that was the family of the mother of George Calvert. So the next time that you see Maryland’s flag on tank tops or swim trunks, you’ll understand their long history. Sources: Maryland: The Seventh State, A History (Third Edition) – Author: John T. Marck – Creative Impressions, Ltd. 1995 Exploring Maryland’s Roots - http://mdroots.thinkport.org/library/kingqueen.asp Historic St. Mary’s City - https://hsmcdigshistory.org/research/maritime-curation/ark-and-dove/ Maryland Manual Online - https://msa.maryland.gov/msa/mdmanual/01glance/html/symbols/seal.html Maryland Manual Online - https://msa.maryland.gov/msa/mdmanual/01glance/html/symbols/flag.html
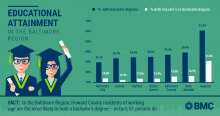
We recently worked with the Greater Baltimore Committee to explore how the Baltimore region stacks up against 19 of its peers around the country and how we’ve changed during the last two decades. This comparison included our neighbors to the north - Pittsburgh and Philadelphia - as well as to the south - the District of Columbia and Richmond. Educational attainment was among the 80 factors evaluated in the 2018 Greater Baltimore State of the Region Report.Experts often use the share of high school and college graduates in a particular geographic area as proxies for career readiness and workforce talent. Companies, especially high-tech firms, evaluate educational attainment when considering where to locate and grow their operations. Areas with highly educated populations are increasingly attracting these companies and entrepreneurs.So, how does Baltimore measure up on the education front today? How have we changed since 1998? Our report card demonstrates significant progress. Among the metropolitan regions studied, Baltimore ranked seventh among its peers in the share of the working age population (adults 25 years and older) holding a bachelor’s degree or higher credential, according to 2015 American Community Survey data. Today, 37.3 percent of the region has a four-year college degree. That’s a significant increase from less than 25 percent in 1998, when we ranked thirteenth.The Washington, D.C. metropolitan region, on the other hand, with its abundance of higher education institutions, federal agencies and vibrant business climate boasts a working age population (25+) with 49 percent holding college diplomas. This earned Washingtonians the No. 1 spot on our rankings. By comparison, Philadelphia (eleventh) and Richmond (twelfth) had 34.8 percent and 33.7 percent college educated populations, respectively. Pittsburghers, on the other hand, ranked seventeenth with 31.5 percent. However, the Steel City and its surrounding counties significantly improved their position from last place and 19.7 percent in 1998.Similarly, the share of working aged adults whose education stopped with a high school diploma also increased over the last 20 years. Between 1998 and 2017, the Baltimore region improved from 18 percent high school education to 26.3 percent, jumping from tenth to eighth among its peers. On this measure, Pittsburgh led the pack with 34.9 percent, followed by Philadelphia with 30.3 percent. Virginia’s capital (Richmond), too, edged out our region by just one tenth of a percent, landing in the number seven spot on our list.But what about your county, you ask? For a closer look at educational attainment by jurisdiction, we consulted 2016 American Community Survey data.In our region, Howard County residents of working age are the most likely to hold a bachelor’s degree or higher – in fact, 61 percent do. Anne Arundel County came in second place on this measure with 39.4 percent and Baltimore County followed with 37.2 percent - right around the average for the region. About 35 percent of Queen Anne’s residents are college graduates, while the number is 34.5 percent in Harford, 33.7 percent in Carroll and 29.7 percent in Baltimore City.If you’re looking for workers with a terminal education of a high school diploma or an equivalency, Carroll County tops the region with 30.6 percent of its residents. This is followed closely by Queen Anne’s with 29.8 percent and Baltimore City with 29.6 percent. A little more than one in four Harford residents (27.8 percent) and 27.2 percent of Baltimore County residents hold high school diplomas but no additional credentials. Anne Arundel and Howard were the only two counties to fall below the regional average of 26.3 percent with 24.5 percent and 14 percent, respectively.Perhaps not surprisingly, Howard County is also home to the largest share of working aged people with graduate or professional degrees. Nearly one-third of Howard residents (31 percent) hold a master’s or doctorate. Anne Arundel its neighbors to the west by almost half at 16.3 percent, followed by Baltimore County at 15.8 percent. A significant number of Baltimore City residents (14 percent) are graduate level educated, followed closely by Harford and Queen Anne’s, each with 13.8 percent and Carroll with 12.3 percent.While degree attainment may differ from one jurisdiction to another, these statistics demonstrate that the Baltimore region on the whole has become increasingly educated during the last two decades.So, graduation caps off to our region and to all the students walking across the stage this spring! May your studies continue to enrich the fabric of our community and make Baltimore an even more enticing place to start and grow a business.Source:State of the Region Report – Page 39
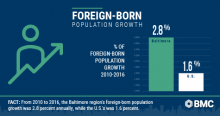
If you’re anything like us, you also found yourself glued to your television, watching the 2018 Winter Olympics in PyeongChang, South Korea. These events are a wonderful way for us to cheer on the United States, watch obscure sports (we’re talking about you, biathlon), and celebrate countries and cultures from around the world. In the opening ceremonies alone, we heard a moving rendition of John Lennon’s “Imagine” and witnessed the enthusiastic return of Tonga’s shiny flag-bearer. In this year’s games we also saw, for the first time, an historic gesture of cooperation in the North and South Korean joint women’s hockey team. The flags, pageantry and intense competition make us proud to be American and remind us of the interconnected nature of our world. So BMC’s data crunchers were a bit curious about the rich cultural fabric of our own backyard – what’s the demographic breakdown of foreign-born residents in the Baltimore region? Foreign-born residents continue to move to the Baltimore region, even 289 years after the city’s founding and 150 years after the first steamships docked in the Locust Point neighborhood to unload passengers. We took a look at the Baltimore region’s foreign born population from 1970 to 2016, which is the most recent data available. In 1970, the total foreign born population in the Baltimore region was 2.8 percent of 2.1 million residents, while Maryland’s was 3.2 percent of 3.7 million residents, and the U.S. had 4.8 percent among 193 million residents. By 2016, Baltimore’s foreign born population shot to 10.4 percent of its 2.8 million residents. Compare that to 15.3 percent of Maryland’s 6 million residents and 13.5 percent of the U.S.’s 323 million residents. While this wasn’t particularly surprising, what we found interesting is that since 1990, the Baltimore region’s foreign-born population is growing at a faster rate than both Maryland and the U.S. From 2010 to 2016, the Baltimore region’s foreign-born growth is 2.8 percent annually, while Maryland’s is 2.5 percent, and the nation as a whole is 1.6 percent. In addition, foreign-born residents are coming to the Baltimore region from vastly different countries in 2016 than they did in 1970. In 1970, 64.7 percent of foreign-born residents in the Baltimore region came from European countries, whereas only 11.1 percent came from Europe by 2010. By comparison, 9.3 percent of the region’s foreign-born residents came from Asian countries in 1970, while 38.7 percent came from Asia in 2010. For more specific information about our region’s foreign-born residents, we then dug into the U.S. Census Bureau’s American Community Survey for 2016. In 2016, 9.7 percent of the Baltimore region’s foreign-born residents were from India, followed by 6.9 percent from Korea, 5.9 percent from China, and 5 percent each from El Salvador and the Philippines. In Maryland, 12.1 percent of the foreign-born population, the highest for the state, came from El Salvador. By contrast, the largest share of the U.S.’s foreign-born population - 26.5 percent - came from Mexico. While we patiently await the 2020 Summer Olympics in Tokyo when we can again don our Team USA gear, remember there is a wealth of cultural diversity to be celebrated right here at home in greater Baltimore each and every day. Sources: IPUMS NHGIS, University of Minnesota, www.nhgis.org; U.S. Census Bureau American Community Survey 2016
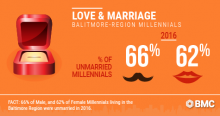
Happy couples will celebrate Valentine’s Day all around the Baltimore region this week. Some will dine at candle-lit restaurants, or buy each other gifts and funny greeting cards. Others might even surprise their beloved with a marriage proposal. Ain’t love a beautiful thing? While it may seem like those married folks are the majority, that’s not the case for Millennials in the Baltimore region. More than 60 percent of Millennials – that’s individuals born between 1977 and 1994 - were unmarried in 2016, according to an analysis of U.S. Census Bureau, Decennial and American Community Survey data. That’s 66 percent of our region’s adult males (222,700 of them) and 62 percent of adult females (218,000), an increase of 15 percent since 1990 for adults ages 22 to 39. Likewise, Millennials in the Baltimore region are getting married later in life, according to the same Census data analysis. The 2016 median age of first marriages for local brides and grooms is 29, while nationally it’s 29.5 for males and 27.4 for females.2 Compare that to 1990, when the median age for first marriages in the U.S. was 26.1 for males and 23.9 for females! Millennials are staying single for longer, and they’re also more educated. Almost half (47 percent) of unmarried females and more than a third (37 percent) of unmarried males have achieved an Associate’s Degree at minimum. If all this chatter about love and romance making you want to settle down, here’s where you should look… Unsurprisingly, Baltimore City has the most single Millennials – more than a third of the region’s unmarried men and women. Baltimore County and Anne Arundel County have 120,500 and 83,400 number of unmarried Millennials, respectively, while Carroll County comes in last with 17,600. We guess we’ll never again wonder why Fell’s Point, Towson and Annapolis are so busy on Friday and Saturday nights.