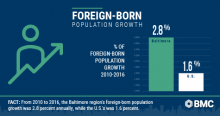
If you’re anything like us, you also found yourself glued to your television, watching the 2018 Winter Olympics in PyeongChang, South Korea. These events are a wonderful way for us to cheer on the United States, watch obscure sports (we’re talking about you, biathlon), and celebrate countries and cultures from around the world. In the opening ceremonies alone, we heard a moving rendition of John Lennon’s “Imagine” and witnessed the enthusiastic return of Tonga’s shiny flag-bearer. In this year’s games we also saw, for the first time, an historic gesture of cooperation in the North and South Korean joint women’s hockey team. The flags, pageantry and intense competition make us proud to be American and remind us of the interconnected nature of our world. So BMC’s data crunchers were a bit curious about the rich cultural fabric of our own backyard – what’s the demographic breakdown of foreign-born residents in the Baltimore region? Foreign-born residents continue to move to the Baltimore region, even 289 years after the city’s founding and 150 years after the first steamships docked in the Locust Point neighborhood to unload passengers. We took a look at the Baltimore region’s foreign born population from 1970 to 2016, which is the most recent data available. In 1970, the total foreign born population in the Baltimore region was 2.8 percent of 2.1 million residents, while Maryland’s was 3.2 percent of 3.7 million residents, and the U.S. had 4.8 percent among 193 million residents. By 2016, Baltimore’s foreign born population shot to 10.4 percent of its 2.8 million residents. Compare that to 15.3 percent of Maryland’s 6 million residents and 13.5 percent of the U.S.’s 323 million residents. While this wasn’t particularly surprising, what we found interesting is that since 1990, the Baltimore region’s foreign-born population is growing at a faster rate than both Maryland and the U.S. From 2010 to 2016, the Baltimore region’s foreign-born growth is 2.8 percent annually, while Maryland’s is 2.5 percent, and the nation as a whole is 1.6 percent. In addition, foreign-born residents are coming to the Baltimore region from vastly different countries in 2016 than they did in 1970. In 1970, 64.7 percent of foreign-born residents in the Baltimore region came from European countries, whereas only 11.1 percent came from Europe by 2010. By comparison, 9.3 percent of the region’s foreign-born residents came from Asian countries in 1970, while 38.7 percent came from Asia in 2010. For more specific information about our region’s foreign-born residents, we then dug into the U.S. Census Bureau’s American Community Survey for 2016. In 2016, 9.7 percent of the Baltimore region’s foreign-born residents were from India, followed by 6.9 percent from Korea, 5.9 percent from China, and 5 percent each from El Salvador and the Philippines. In Maryland, 12.1 percent of the foreign-born population, the highest for the state, came from El Salvador. By contrast, the largest share of the U.S.’s foreign-born population - 26.5 percent - came from Mexico. While we patiently await the 2020 Summer Olympics in Tokyo when we can again don our Team USA gear, remember there is a wealth of cultural diversity to be celebrated right here at home in greater Baltimore each and every day. Sources: IPUMS NHGIS, University of Minnesota, www.nhgis.org; U.S. Census Bureau American Community Survey 2016