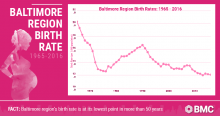
Flowers, brunches and greeting cards full of loving messages are just a few of the ways that we celebrated the mothers in our lives on Sunday, May 13. Thanks for all that you do, moms - you’re awesome! Those packed brunch spots and ransacked floral departments at our local grocery stores caused us to pause and think though - there are a lot of mothers in the Baltimore region, and a lot of mothers mean that there have been a lot of births. So we dug into some data from the Maryland Department of Health and Mental Hygiene and examined the birth rate* in each of the Baltimore region’s seven jurisdictions and the state from 1965 through 2016. What we found was that the Baltimore region’s birth rate is at its lowest point in more than 50 years. This information shouldn’t be surprising, given the increase in females in the workforce, increased use of contraception and cost of living during the last 50 years. In 1965, the Baltimore region’s birth rate was 20.3, while the state’s was 20.9. In 2016, both rates were 12.1. As we continued to analyze the data, we saw that while slightly lower, the region’s birth rate is very similar to that of the state over time. What is notable is when the birth rate takes a sudden hit. Both annual births and birth rates in the Baltimore region declined from the beginning of Generation X in 1965 through the mid-1970s. But then the average birth rate declined drastically from 14.0 in 1972 to 12.6 in 1976. In Queen Anne’s County, the birth rate dropped as low as 9.9 in 1974. What’s interesting about this four-year period is that the birth rate dropped just as the U.S. felt the effects of the 1973 oil crisis and economic recession. It then slowly increased to 13.4 in 1977, and continued to steadily climb through 1990. Baltimore City, in particular, saw its birth rate peak at 19.5, or 2.8 points above the region’s average, in 1990. A similar pattern emerged as the U.S. dipped into the Great Recession after the 2007 subprime mortgage crisis. In the Baltimore region, the average birth rate was 13.5 in 2008, before dropping to 12.9 in 2009. However, Carroll County’s birth rate hovered between 9.2 and 9.6 from 2009 to 2014. So while the Baltimore region’s birth rate remains 1.67 times lower than 50 years ago, a dip in the economy could send it slightly further south. Can we please agree to continue buying those flowers, brunches and greeting cards to do our part in keeping the economy strong? *The birth rate is calculated at the number of births per 1,000 people. Sources: Maryland Department of Health and Mental Hygiene https://www.cia.gov/library/publications/the-world-factbook/rankorder/2054rank.html