American Community Survey - 1216 Rent 30 Annapolis
American Community Survey - 1216 Rent 30 Annapolis
American Community Survey - 1216 Public Trans To Work Annapolis
American Community Survey - 1216 Public Trans To Work Annapolis
American Community Survey - 1216 Mortgage Annapolis
American Community Survey - 1216 Mortgage Annapolis
American Community Survey - 1216 Med HH Income Annapolis
American Community Survey - 1216 Med HH Income Annapolis
Primer For Developing BMC Travel Demand Model - Socioeconomic Inputs
Primer For Developing BMC Travel Demand Model - Socioeconomic Inputs
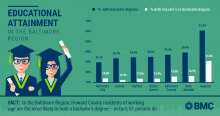
We recently worked with the Greater Baltimore Committee to explore how the Baltimore region stacks up against 19 of its peers around the country and how we’ve changed during the last two decades. This comparison included our neighbors to the north - Pittsburgh and Philadelphia - as well as to the south - the District of Columbia and Richmond. Educational attainment was among the 80 factors evaluated in the 2018 Greater Baltimore State of the Region Report.Experts often use the share of high school and college graduates in a particular geographic area as proxies for career readiness and workforce talent. Companies, especially high-tech firms, evaluate educational attainment when considering where to locate and grow their operations. Areas with highly educated populations are increasingly attracting these companies and entrepreneurs.So, how does Baltimore measure up on the education front today? How have we changed since 1998? Our report card demonstrates significant progress. Among the metropolitan regions studied, Baltimore ranked seventh among its peers in the share of the working age population (adults 25 years and older) holding a bachelor’s degree or higher credential, according to 2015 American Community Survey data. Today, 37.3 percent of the region has a four-year college degree. That’s a significant increase from less than 25 percent in 1998, when we ranked thirteenth.The Washington, D.C. metropolitan region, on the other hand, with its abundance of higher education institutions, federal agencies and vibrant business climate boasts a working age population (25+) with 49 percent holding college diplomas. This earned Washingtonians the No. 1 spot on our rankings. By comparison, Philadelphia (eleventh) and Richmond (twelfth) had 34.8 percent and 33.7 percent college educated populations, respectively. Pittsburghers, on the other hand, ranked seventeenth with 31.5 percent. However, the Steel City and its surrounding counties significantly improved their position from last place and 19.7 percent in 1998.Similarly, the share of working aged adults whose education stopped with a high school diploma also increased over the last 20 years. Between 1998 and 2017, the Baltimore region improved from 18 percent high school education to 26.3 percent, jumping from tenth to eighth among its peers. On this measure, Pittsburgh led the pack with 34.9 percent, followed by Philadelphia with 30.3 percent. Virginia’s capital (Richmond), too, edged out our region by just one tenth of a percent, landing in the number seven spot on our list.But what about your county, you ask? For a closer look at educational attainment by jurisdiction, we consulted 2016 American Community Survey data.In our region, Howard County residents of working age are the most likely to hold a bachelor’s degree or higher – in fact, 61 percent do. Anne Arundel County came in second place on this measure with 39.4 percent and Baltimore County followed with 37.2 percent - right around the average for the region. About 35 percent of Queen Anne’s residents are college graduates, while the number is 34.5 percent in Harford, 33.7 percent in Carroll and 29.7 percent in Baltimore City.If you’re looking for workers with a terminal education of a high school diploma or an equivalency, Carroll County tops the region with 30.6 percent of its residents. This is followed closely by Queen Anne’s with 29.8 percent and Baltimore City with 29.6 percent. A little more than one in four Harford residents (27.8 percent) and 27.2 percent of Baltimore County residents hold high school diplomas but no additional credentials. Anne Arundel and Howard were the only two counties to fall below the regional average of 26.3 percent with 24.5 percent and 14 percent, respectively.Perhaps not surprisingly, Howard County is also home to the largest share of working aged people with graduate or professional degrees. Nearly one-third of Howard residents (31 percent) hold a master’s or doctorate. Anne Arundel its neighbors to the west by almost half at 16.3 percent, followed by Baltimore County at 15.8 percent. A significant number of Baltimore City residents (14 percent) are graduate level educated, followed closely by Harford and Queen Anne’s, each with 13.8 percent and Carroll with 12.3 percent.While degree attainment may differ from one jurisdiction to another, these statistics demonstrate that the Baltimore region on the whole has become increasingly educated during the last two decades.So, graduation caps off to our region and to all the students walking across the stage this spring! May your studies continue to enrich the fabric of our community and make Baltimore an even more enticing place to start and grow a business.Source:State of the Region Report – Page 39
Sea Level Rise - Queen Anne's County
Sea Level Rise - Queen Anne's County
Sea Level Rise - Harford County
Sea Level Rise - Harford County
Sea Level Rise - Baltimore County
Sea Level Rise - Baltimore County
Sea Level Rise - Baltimore City
Sea Level Rise - Baltimore City